From the beginning of 2019 to May 1st, Andrew Miller threw 11 1/3 innings in his first 16 appearances as a Cardinal. While he did an incredible job striking people out (12.71 K/9), he was walking a ridiculous amount as well (7.15 BB/9) and allowing homers at an even more alarming rate (3.18 HR/9). Even worse, he was only getting ground balls 28.6% of the time, so his 36.4% HR/FB rate was made even more extreme by the lack of balls being hit on the ground. Due to the high amounts of walks and homers, the average of his ERA and his three individual skill based ERA indicators (FIP, xFIP, and SIERA) was 5.88. That is not #good. According to Fangraphs, in that (just over) one month of baseball, Miller was worth a half a win less than replacement. Basically, the Cardinals were paying him a lot of money to provide wins to the opponents.
Since May 1st, however, Andrew Miller has thrown 9 1/3 innings in 11 appearances. He has still struck out a fantastic 11.57 men per 9 innings, but his BB/9 number joins that number in elite territory at 0.96 BB/9. With a 0.96 HR/9 and 47.4% GB rate being much closer to league average, Miller's average of his ERA and his three individual skill based ERA indicators (FIP, xFIP, and SIERA) has been just 1.98 in that time.
From here on out, I'll call the until May 1st portion the "first part" of the year and since May 1st the "second part" of the year.
Hat tip to Kyle Reis to look this next portion of it up, but Miller has really had zero effectiveness vs. RHH this entire season. However, he's been quite effective as a LOOGY (Lefty-One-Out-GuY) over the second part of the season.
Let's explore those numbers quickly.
In the first part of the year, Miller faced 46.4% left-handed hitters. Against lefties, he had a .250/.423/.550/.873 line against him in 26 PA. Against righties, he had a .250/.400/.542/.942 line against him in 30 PA. Really, there was no difference between how he fared vs. lefties or righties.
In the second part of the year, Miller faced 57.6% left-handed hitters. Against lefties he had a .158/.158/.158/.316 line against him in 19 PA. Against righties, he had a .385/.429/.615/1.044 line against him in 14 PA.
Brief hat tip to Mike Shildt and Mike Maddux as well for upping the number of lefties he's been facing over the last month and limiting the number of righties.
Now keep in mind, we are looking at two extremely small sample sizes here, so the "turnaround" I mention in the title is complete conjecture at this point for whether or not that will continue. However, he has made some distinct adjustments, whether consciously or not.
He has actually thrown his two pitches, the 4-seam fastball and the slider, the same percentage of the time to left-handed hitters over this time frame. However, the look of his pitches are different.
4-seam fastball
His 4-seam fastball over the first part of the year averaged 93.6 mph with 14.25 inches of vertical break (with gravity) and 4.62 inches of horizontal break. Over the second part of the year, that 4-seam fastball has lost 1.2 miles per hour, but has gained 1.64 inches of vertical break while losing 0.12 inches of (basically identical) horizontal break.
Slider
His slider over the first part of the year averaged 83.16 mph with 36.15 inches of vertical break (with gravity) and 6.23 inches of horizontal break. Over the second part of the year, that slider has lost 0.79 miles per hour, but has gained 1.23 inches of vertical movement while having basically identical horizontal break.
Here's how that looks in tabular form (for both pitches):

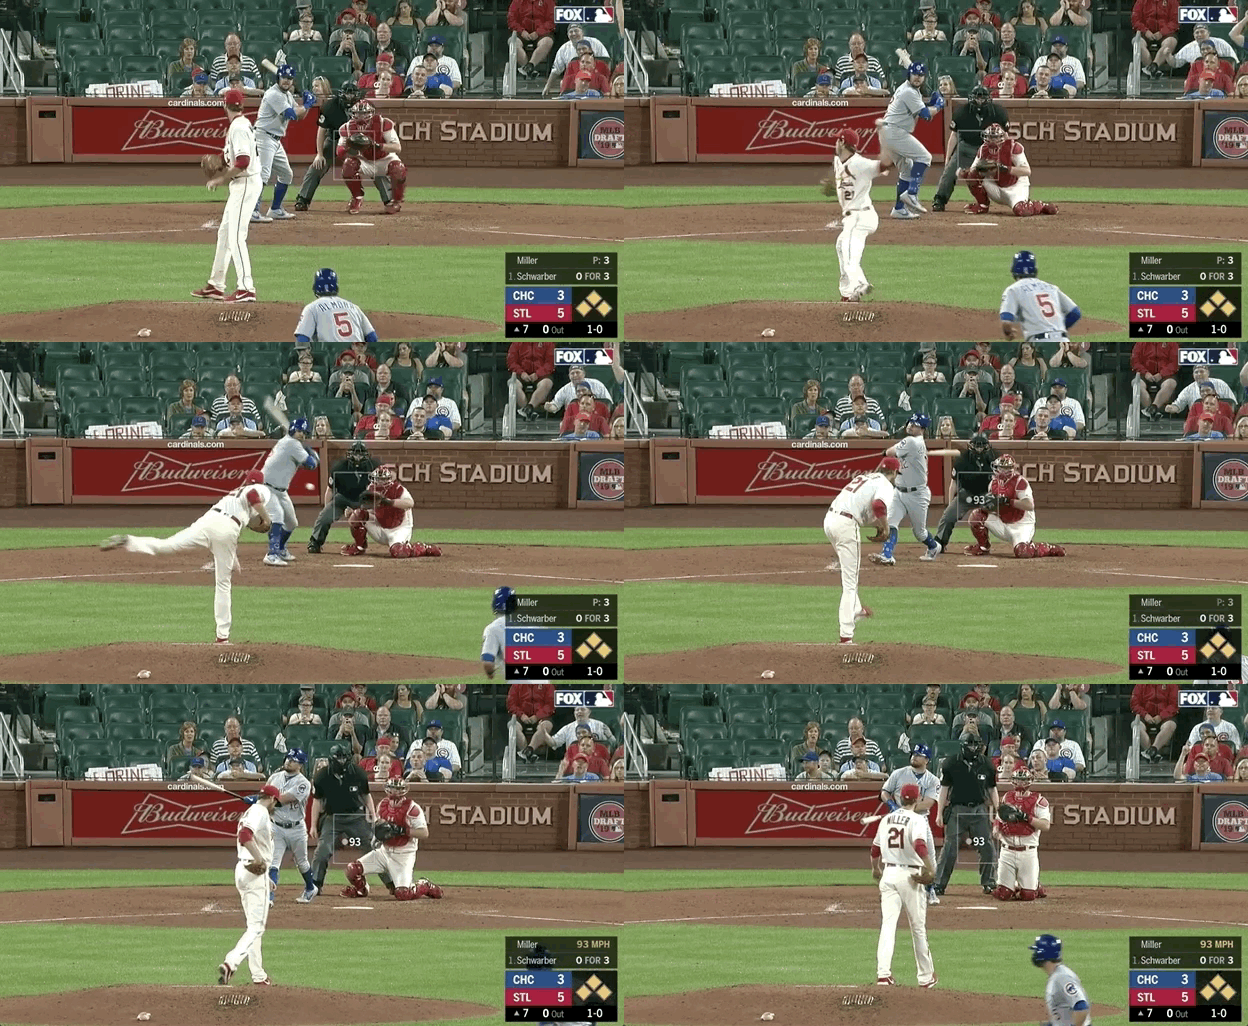
Visually how does this look with the fastballs?
Well, the difference between a bases empty Christian Yelich homer in a pitcher's count with a middle-in pitch (left - top on mobile) and a bases loaded Kyle Schwarber swing and miss in a batter's count with a middle-in pitch (right - bottom on mobile) might just be that extra 1.64 inches of vertical break on the ball.
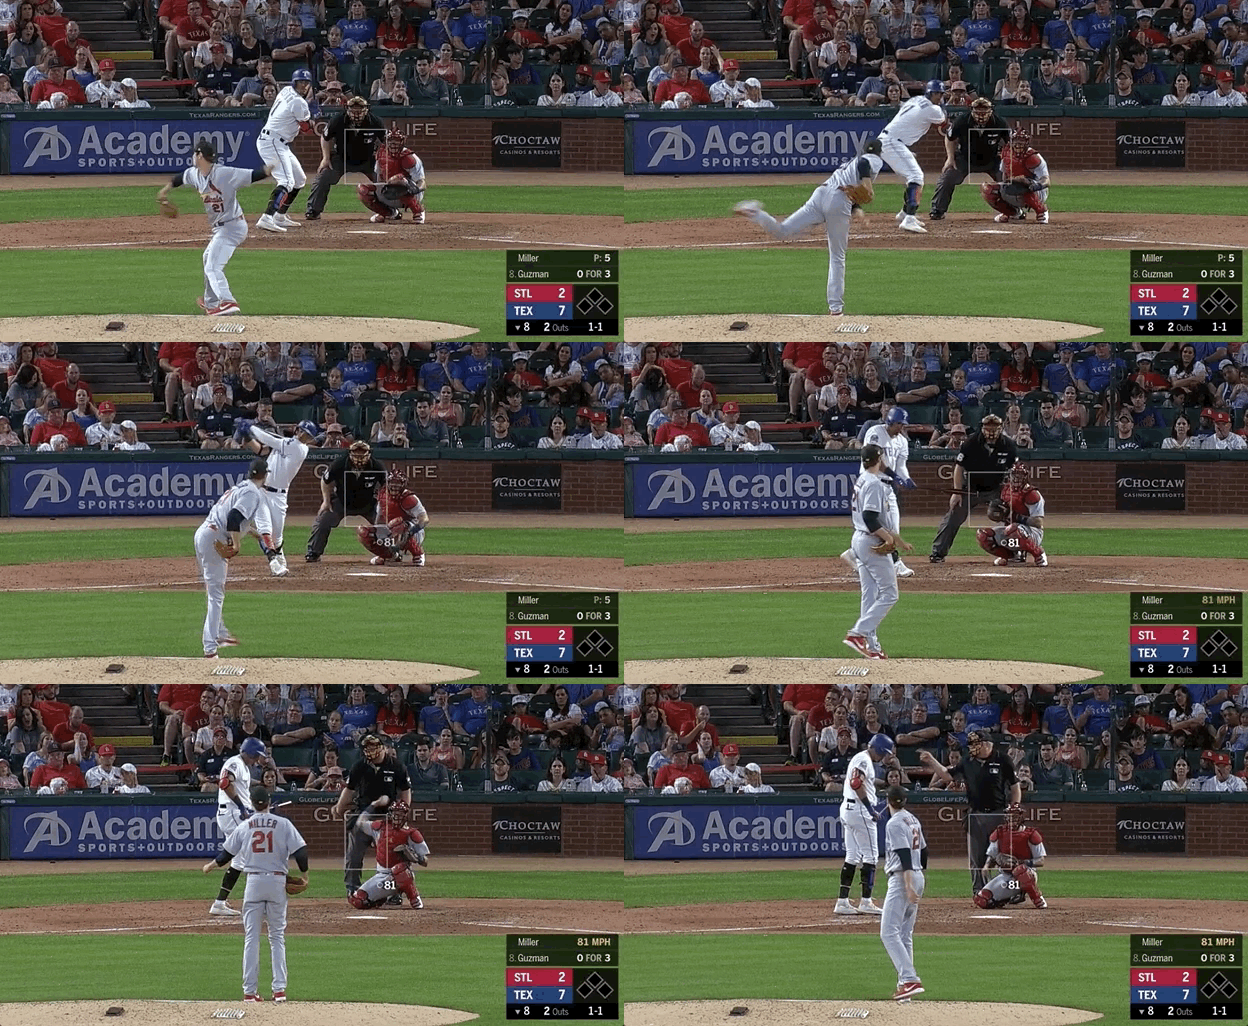
Visually how does this look with the sliders?
The difference between Travis Shaw getting just enough of the bat on a low and away 1-0 slider to get a cheap single (left - top on mobile) and Ronald Guzman swinging through a 1-1 slider to create a pitcher's count (right - bottom on mobile) might just be that extra 1.23 inches of vertical break on the ball.
OK. So I must thank Fangraphs, Brooks Baseball, and Baseball Savant for various aspects of the data shown in this article. I also would be remiss if I didn't thank Nicholas Childress for the .gifs and cover art on this article.


Comments